Hot Inflation • Stocks Plunge • Shelter Effects Hit
- U.S. equity markets plunged Tuesday after CPI data showed an unexpected acceleration in inflation last month, likely keeping the Federal Reserve committed to aggressive monetary tightening over the coming months.
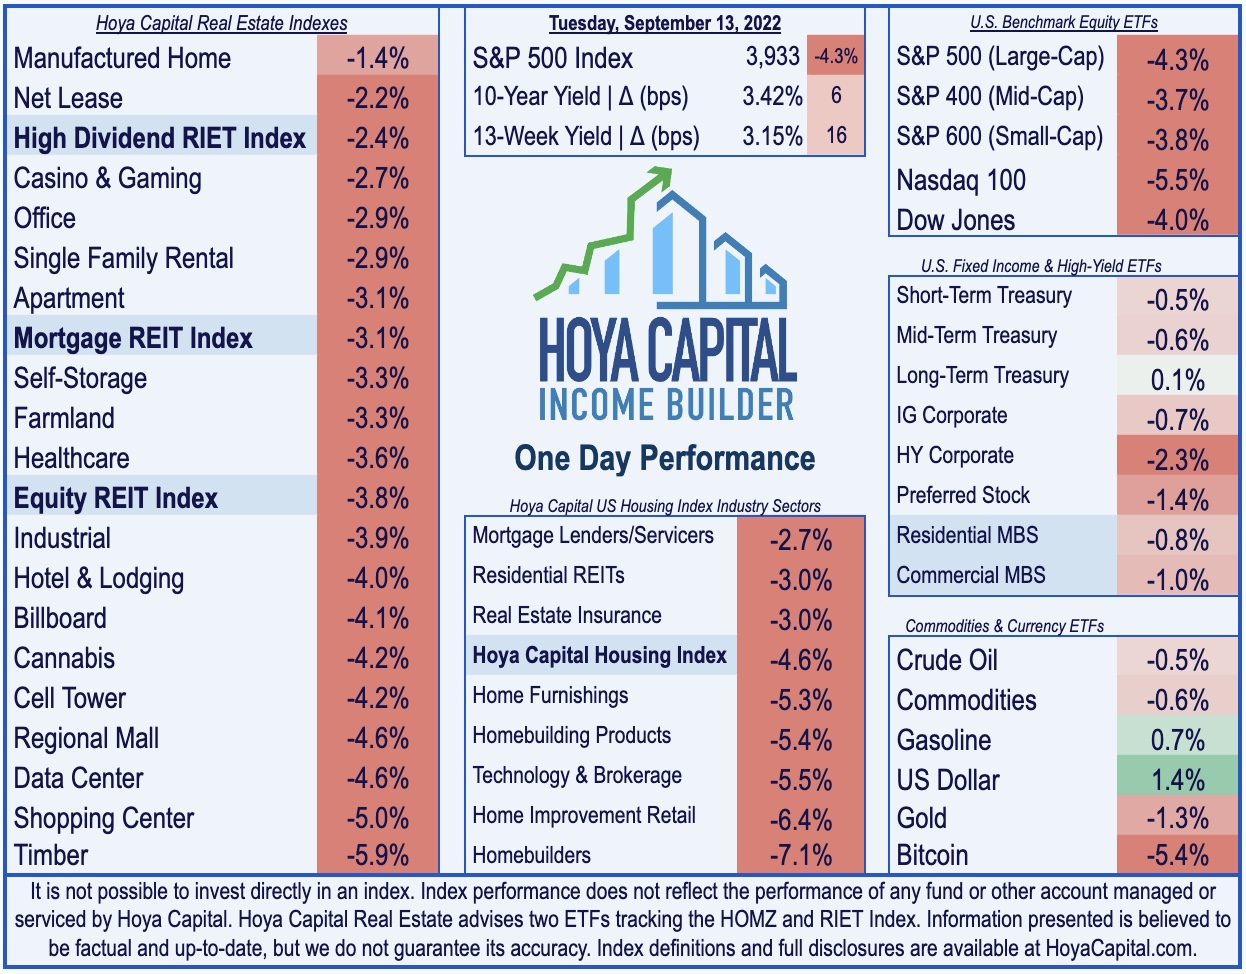
- Posting its steepest single-day decline since the depths of the pandemic in mid-2020, the S&P 500 dipped by 4.3% today - erasing its best four-day gains since June.
- The Dow plunged by more than 1,200 points while the US Dollar Index surged to fresh two-decade highs as investors priced in additional Fed rate hikes. REITs and domestic-focused equities were relative outperformers.
- Peak Inflation? Not quite yet. Consumer prices unexpectedly accelerated in August across both the headline CPI and Core CPI metrics driven by largely by the delayed recognition of Shelter Inflation, which had been understated by the lagging CPI indexes over the past 18 months.
- Perhaps overlooked in today's data was that CPI excluding-Shelter actually posted its steepest decline since the pandemic, dipping 0.36% following a 0.29% decline in the prior month - suggesting that "real-time" inflation is indeed decelerating even as headline metrics suggest otherwise.
Real Estate Daily Recap
U.S. equity markets plunged Tuesday after CPI data showed an unexpected acceleration in inflation last month, likely keeping the Federal Reserve committed to aggressive monetary tightening over the coming months. Posting its steepest single-day decline since the depths of the pandemic in mid-2020, the S&P 500 dipped by 4.3% today - erasing its best four-day gains since June - while the tech-heavy Nasdaq 100 plunged by 5.5%. The Dow plunged by more than 1,200 points while the US Dollar Index surged to fresh two-decade highs as investors priced in additional Fed rate hikes. Real estate equities were relative-outperformers today, but the Equity REIT Index was still lower by 3.8% today with all 18 property sectors in negative territory while the Mortgage REIT Index declined 3.1%.

Peak Inflation? Not quite yet. Consumer prices unexpectedly accelerated in August across both the headline CPI and Core CPI metrics driven by increases in shelter, food, and medical care costs. The annual increase in the headline Consumer Price Index declined less than expected to an 8.3% rate in August - hotter than the 8.1% expected - while Core CPI actually accelerated to a 6.3% annual rate - hotter than the 6.1% rate expected. The month-over-month headline CPI increased by 0.1% - a disappointment as economists projected the headline CPI to record a second-straight month of sequential declines. The acceleration in the month-over-month rate came despite cooling energy prices as the gasoline index fell 10.6% over the month following a 7.7% decrease in July. Notably, the food index increased 11.4% over the last year, the largest 12-month increase since the period ending May 1979.

As we've discussed for the last year, we're now seeing the impact of the delayed recognition of rising shelter costs, which will increasingly become the primary driver of inflation - a role it assumed for much of the prior decade. The single largest weight in the CPI Index, Shelter inflation is just beginning to filter into the data due to the 12-18 month reporting lag in the BLS series compared to market-based metrics. The shelter index rose 6.2% over the last year, accounting for about 40 percent of the total increase in all items less food and energy. In our new Inflation Heat Map chart below, we illustrate the impact of select categories on the overall inflation rate.

We believe this still understates the actual rise in shelter costs as private market rent data has shown that national rent inflation has been in the 10-15% range over the past twelve months while home values have risen by 15-20%. The Dallas Fed published a report highlighting the data issues at the BLS, finding a 16-month lag between the BLS inflation series and real-time market pricing of home prices and rents which will add an estimated 0.6-1.2% to the Core CPI index in 2022 and 2023. Perhaps overlooked in today's data was that CPI ex-Shelter Index posted its steepest decline since the pandemic, dipping 0.36% following a 0.29% decline in the prior month - suggesting that "real-time" inflation is indeed decelerating even as headline metrics suggest otherwise.

Real Estate Daily Recap
Best & Worst Performance Today Across the REIT Sector

Net Lease: Today we published Net Lease REITs: Inflation Risk Persists on the Income Builder Marketplace. One of the more "bond-like" and rate-sensitive REIT sectors, net lease REITs have surprisingly been among the best-performing property sectors this year despite the challenging rising-rate environment. Even with rent growth significantly lagging inflation, net lease REITs are still on-pace for double-digit earnings growth as robust accretive external growth has more than offset the drag from muted property-level growth. Net lease REIT investors aren't buying the "new normal" of permanently elevated inflation and while our base case is that inflation will return to the 2-3% level by the end of next year as pandemic-era fiscal policy normalizes, there appears to be some complacency reflected in valuations of REITs more exposed to upside inflation risks. In the report, we take a deep-dive into the inflation risk across the sector.

Single-Family Rentals: Last Friday, we published Single Family Rental REITs: Renting the American Dream. One of the best-performing property sectors over the past quarter, SFR REITs have been beneficiaries of surging mortgage rates, which has made renting single-family homes a relative bargain. Single-family rents rose at the fastest pace on record through mid-2022, an elevated pace that has staying-power given the significant 'embedded' rent growth resulting from below-market renewal offers as SFR REITs have "throttled" rent hikes on existing tenants. Cooling home price appreciation and tightening credit conditions have prompted many smaller SFR investors to pull back, providing a more favorable external growth environment for the three SFR REITs - American Homes (AMH), Invitation Homes (INVH), and Tricon Residential (TCN).

Mortgage REIT Daily Recap
Per the REIT Rankings Tracker available to Income Builder subscribers, mortgage REITs held up relatively well amid the market carnage as residential mREITs declined by 2.5% while commercial mREITs declined by 3.1%. After the close today, five mREITs declared dividends that were in line with their current rate - KKR Real Estate (KREF), TPG Real Estate (TRTX), Redwood Trust (RWT), MFA Financial (MFA), and Apollo Commercial (ARI). We've seen 13 mREITs increase their dividend this year and 4 dividend cuts.

Economic Data This Week
Inflation data highlight a busy week of economic data in the week ahead of the Fed's September meeting. Following today's Consumer Price Index report, tomorrow we'll see the Producer Price Index for August. Friday, we'll get our first look at Michigan Consumer Sentiment for September. The Fed is particularly interested in the 5-Year Inflation Expectations survey, looking for signs of a potential "wage-price inflation spiral" through elevated consumer wage expectations.

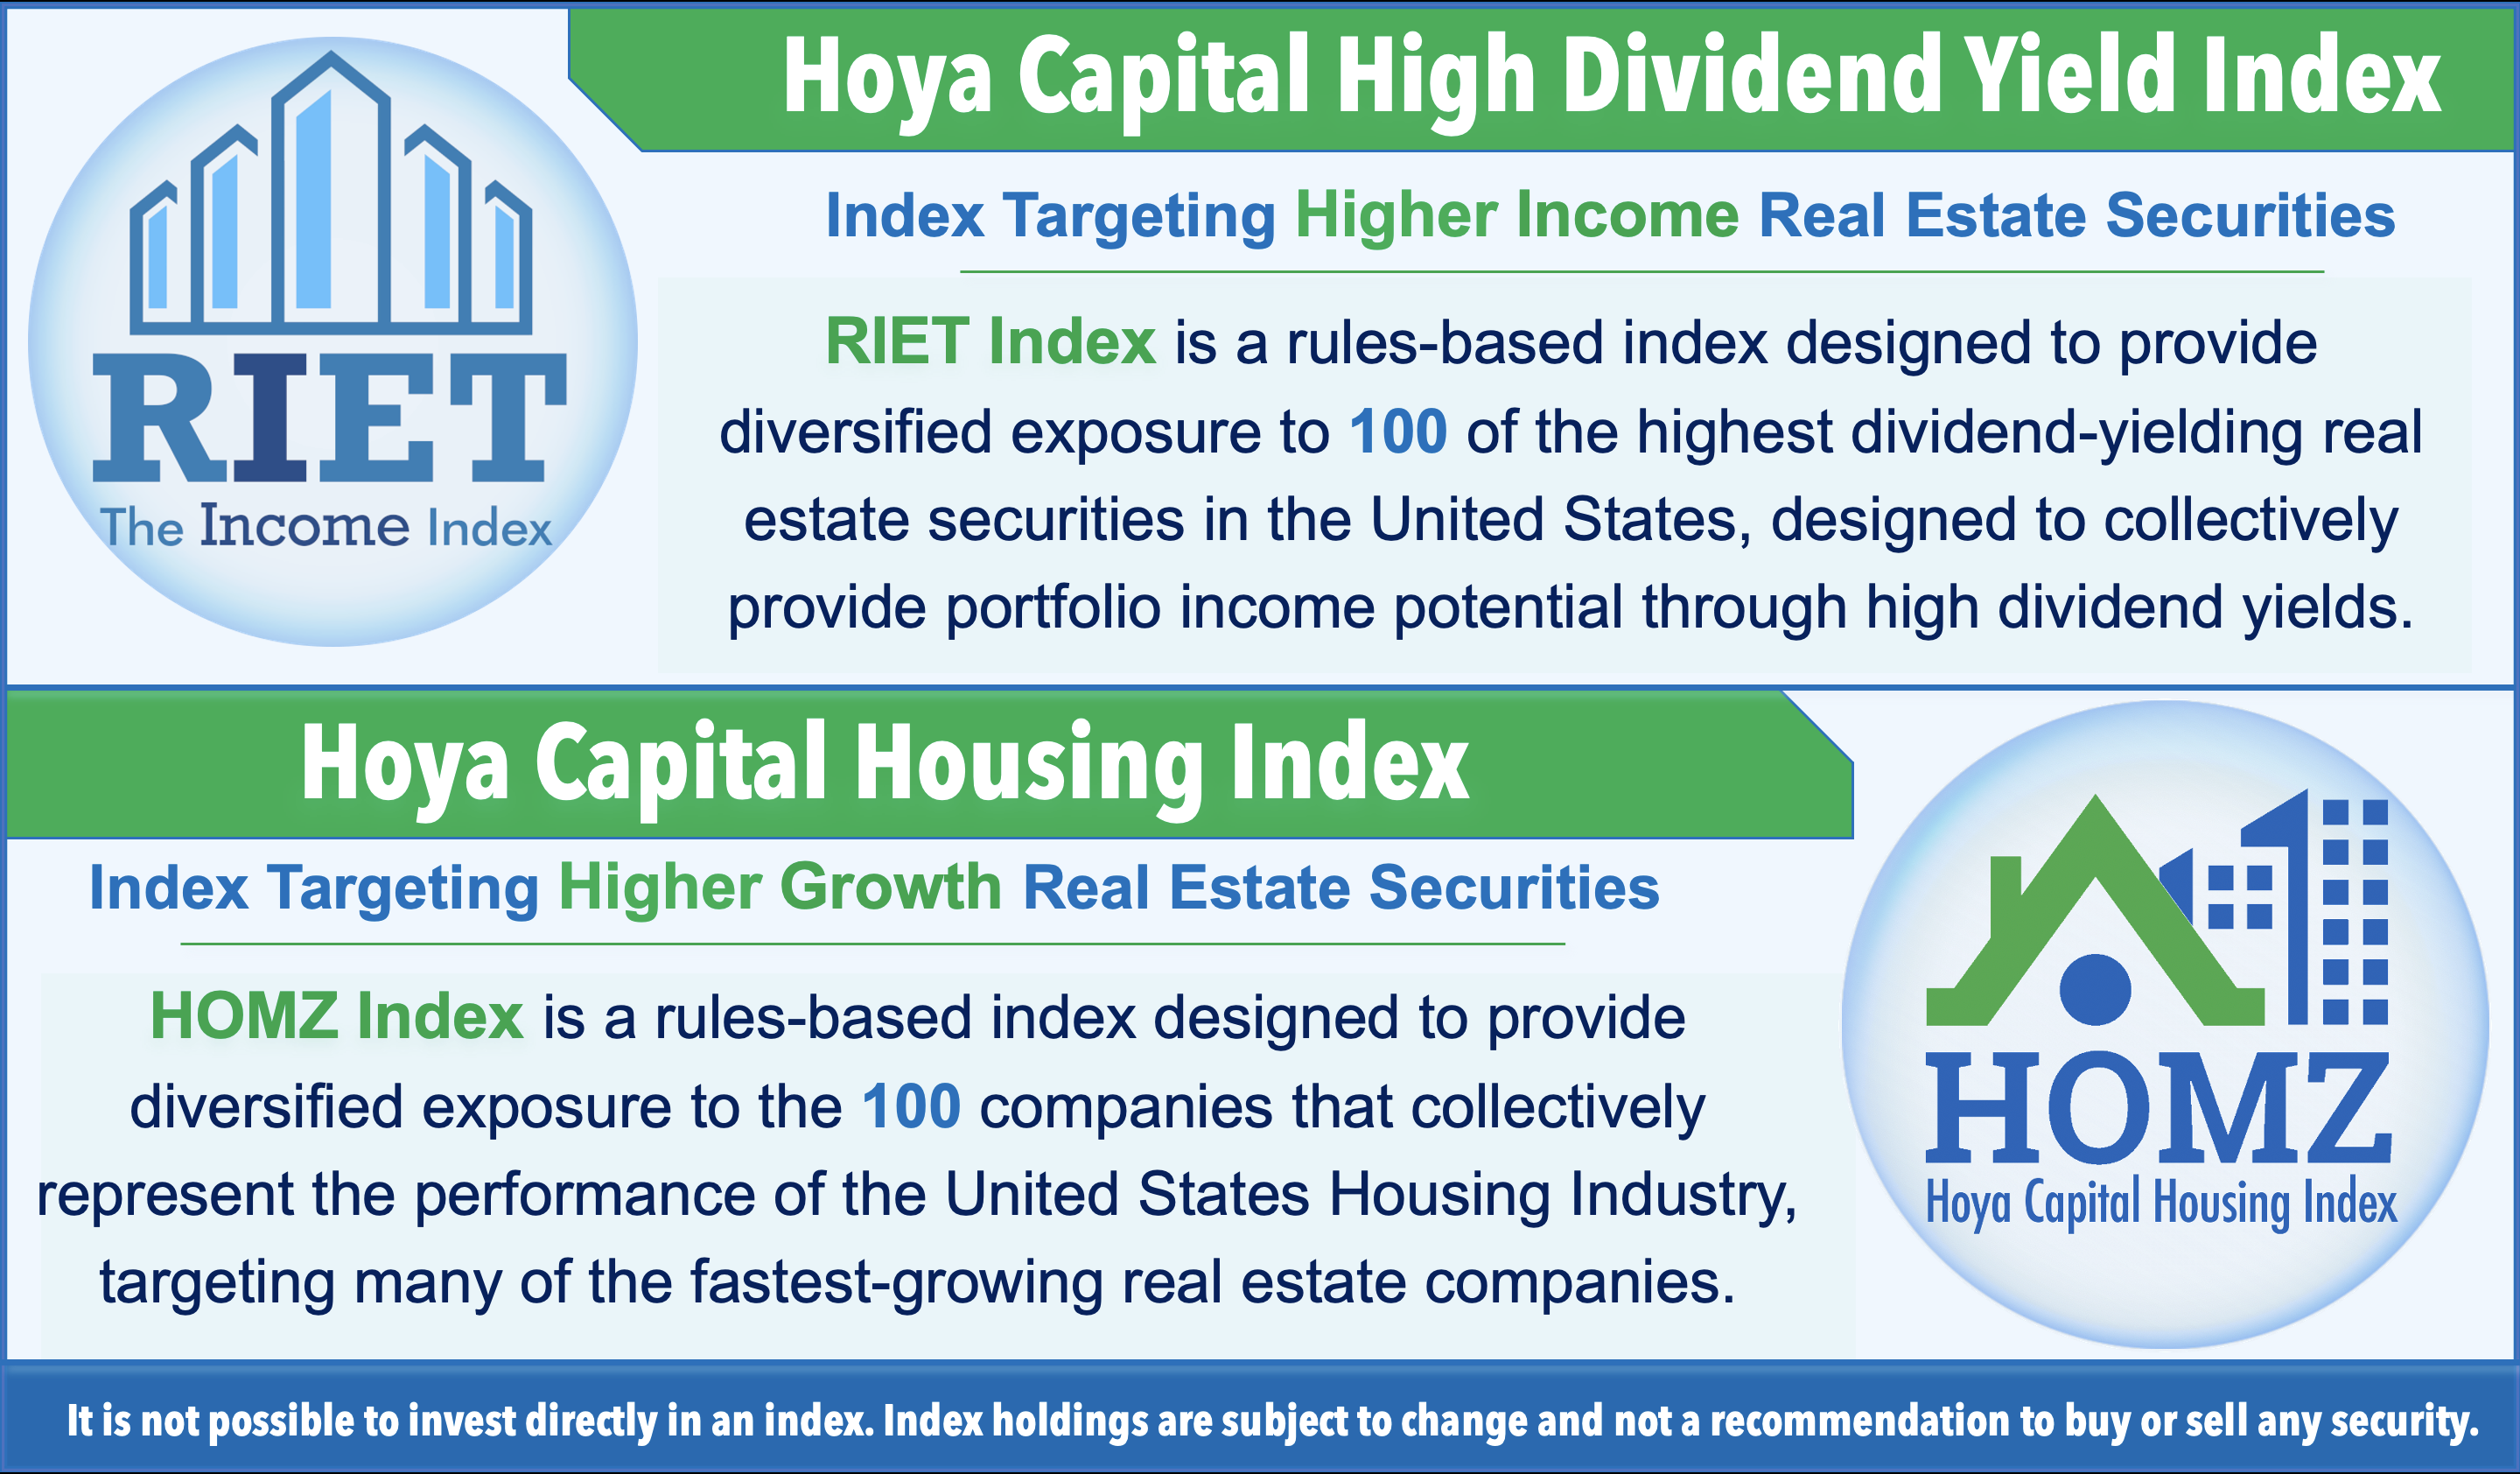
Disclosure: Hoya Capital Real Estate advises two Exchange-Traded Funds listed on the NYSE. In addition to any long positions listed below, Hoya Capital is long all components in the Hoya Capital Housing 100 Index and in the Hoya Capital High Dividend Yield Index. Index definitions and a complete list of holdings are available on our website.

Hoya Capital Research & Index Innovations (“Hoya Capital”) is an affiliate of Hoya Capital Real Estate, a registered investment advisory firm based in Rowayton, Connecticut that provides investment advisory services to ETFs, individuals, and institutions. Hoya Capital Research & Index Innovations provides non-advisory services including market commentary, research, and index administration focused on publicly traded securities in the real estate industry.
This published commentary is for informational and educational purposes only. Nothing on this site nor any commentary published by Hoya Capital is intended to be investment, tax, or legal advice or an offer to buy or sell securities. This commentary is impersonal and should not be considered a recommendation that any particular security, portfolio of securities, or investment strategy is suitable for any specific individual, nor should it be viewed as a solicitation or offer for any advisory service offered by Hoya Capital Real Estate. Please consult with your investment, tax, or legal adviser regarding your individual circumstances before investing.
The views and opinions in all published commentary are as of the date of publication and are subject to change without notice. Information presented is believed to be factual and up-to-date, but we do not guarantee its accuracy and it should not be regarded as a complete analysis of the subjects discussed. Any market data quoted represents past performance, which is no guarantee of future results. There is no guarantee that any historical trend illustrated herein will be repeated in the future, and there is no way to predict precisely when such a trend will begin. There is no guarantee that any outlook made in this commentary will be realized.
Readers should understand that investing involves risk and loss of principal is possible. Investments in real estate companies and/or housing industry companies involve unique risks, as do investments in ETFs. The information presented does not reflect the performance of any fund or other account managed or serviced by Hoya Capital Real Estate. An investor cannot invest directly in an index and index performance does not reflect the deduction of any fees, expenses or taxes.
Hoya Capital Real Estate and Hoya Capital Research & Index Innovations have no business relationship with any company discussed or mentioned and never receives compensation from any company discussed or mentioned. Hoya Capital Real Estate, its affiliates, and/or its clients and/or its employees may hold positions in securities or funds discussed on this website and our published commentary. A complete list of holdings and additional important disclosures is available at www.HoyaCapital.com.
