Retail Sales • Homebuilder Sentiment • Debt Talks
U.S. equity markets slumped Tuesday as investors awaited updates on debt ceiling negotiations and parsed a generally-upbeat slate of economic data showing resilience in retail spending and a housing market rebound.
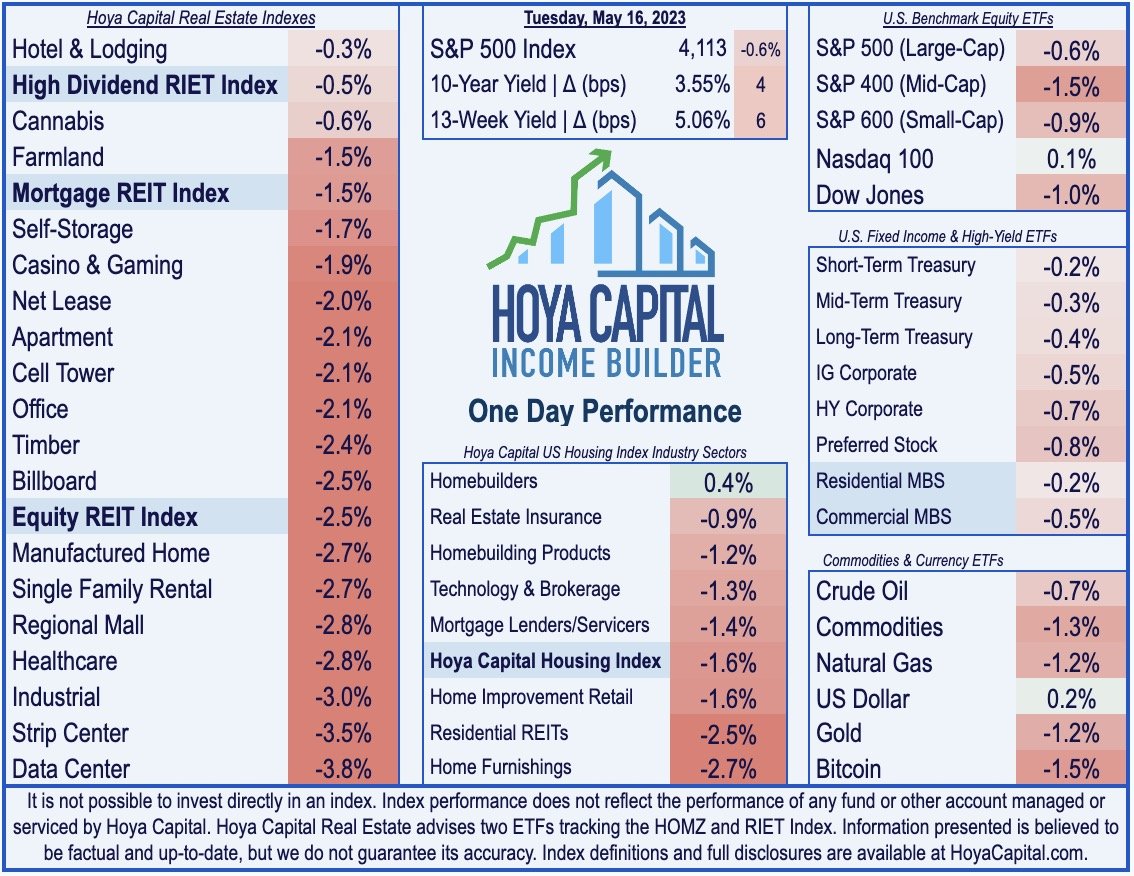
Giving back yesterday's advance of 0.3%, the S&P 500 slipped 0.6% today while the Mid-Cap 400 dipped 1.5% and the Small-Cap 600 declined 0.9%. The Dow dipped 336 points.
Pressured by a rise in benchmark interest rates, real estate equities were among the laggards today, as the Equity REIT Index slipped 2.5% today, with all 18 property sectors in negative-territory.
NAHB Homebuilder Sentiment - a leading indicator of housing market activity - rose for a fifth-straight month in May, which follows a stretch of thirteen straight monthly declines.
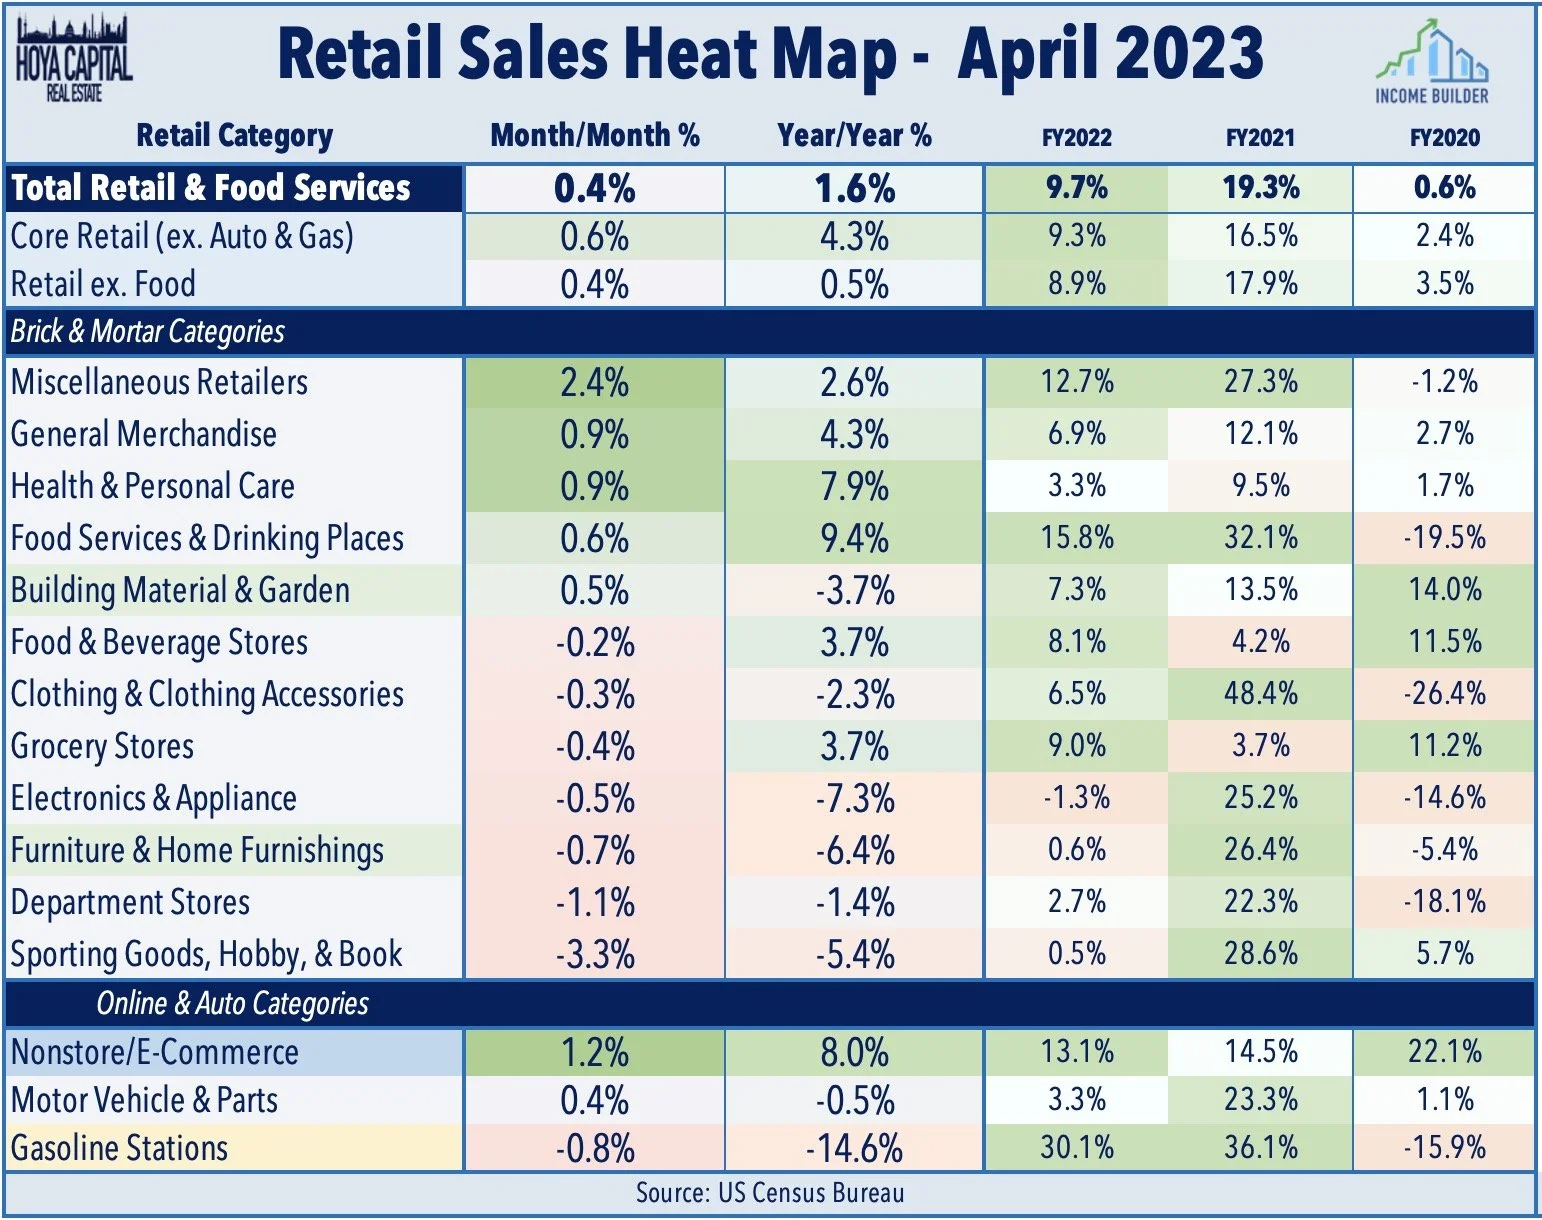
Retail sales data this morning provided mixed signals on the state of the U.S. consumer, showing that spending rose at a weaker-than-expected pace in April, but the "miss" was largely driven by reduced spending at gasoline stations.
Income Builder Daily Recap
U.S. equity markets slumped Tuesday as investors awaited updates on debt ceiling negotiations and parsed a generally-upbeat slate of economic data showing resilience in retail spending and a housing market rebound. Giving back yesterday's advance of 0.3%, the S&P 500 slipped 0.6% today while the Mid-Cap 400 dipped 1.5% and the Small-Cap 600 declined 0.9%. The tech-heavy Nasdaq 100 managed to eke out a modest gain, but the Dow dipped 336 points. Pressured by a rise in benchmark interest rates, real estate equities were among the laggards today, as the Equity REIT Index slipped 2.5% today, with all 18 property sectors in negative territory, while the Mortgage REIT Index finished higher lower 1.5%. Homebuilders were again among the leaders, however, after homebuilder sentiment data showed a fifth-straight monthly advance after dipping to near-15-year lows last year.
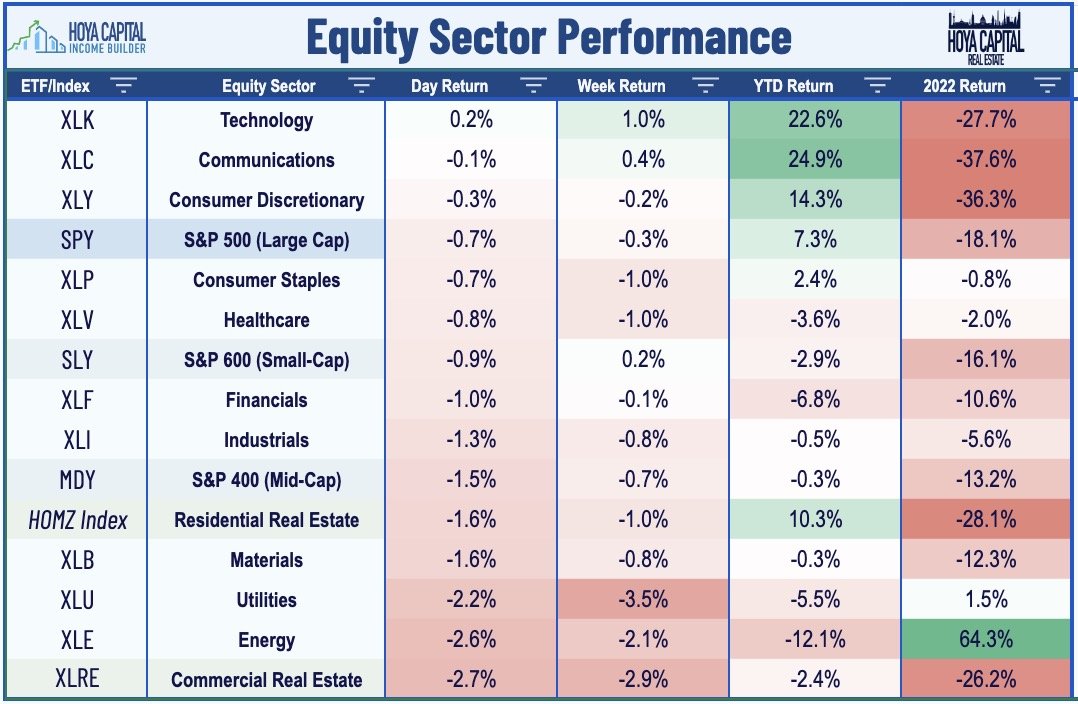
Bonds traded lower today across the credit and maturity curve, pressured by the solid slate of economic data and debt ceiling concerns. The policy-sensitive 2-Year Treasury Yield jumped 8 basis points to 4.08% today, while the 10-Year Yield rose another 4 basis points to 3.55%. Negotiations were ongoing between President Biden and House Speaker McCarthy at the close of trading. Commodities prices remained near their lows of the year after economic data from China overnight was weaker than expected. A cautious outlook on the state of the U.S. consumer from retailer Home Depot (HD) also weighed on investor sentiment. Ten of the eleven GICS equity sectors trade lower today, with Real Estate (XLRE) and Energy (XLE) stocks dragging on the downside.
Retail sales data this morning provided mixed signals on the state of the U.S. consumer, showing that spending rose at a weaker-than-expected pace in April, but the "miss" was largely driven by reduced spending at gasoline stations. The value of retail purchases rose 0.4% after an upwardly revised 0.7% decrease in March, which was below consensus estimates of 0.8%. Excluding autos and gasoline, however, retail sales increased 0.6%, which was above estimates of 0.2%. Seven out of 13 retail categories rose last month, including advances at general merchandise outlets and online merchants. Total retail sales are now higher by just 0.5% from last year, which is the slowest annual growth rate since the pandemic declines in April and May 2020. As these figures aren’t adjusted for inflation, "real" retail spending is lower by 4.5% from last year after adjustment using the headline CPI Index.
Real Estate Daily Recap
Best & Worst Performance Today Across the REIT Sector
Homebuilders: Consistent with the countercyclical performance trends it exhibited early in the pandemic, the previously-sluggish U.S. housing sector has again emerged as a bright spot in recent months. Data this morning showed that NAHB Homebuilder Sentiment - a leading indicator of housing market activity - rose for a fifth-straight month in May, which follows a stretch of thirteen straight monthly declines. Rising to 50 on the headline index with gains in the current sales and future sales sub-indexes, builders attributed improving sentiment to low inventory levels and a moderation in mortgage rates. Measures of current sales and sales expectations rose to the highest level since the summer. A gauge of prospective buyer traffic also edged up to a 10-month high. DR Horton (DHI), Taylor Morrison (TMHC), and PulteGroup (PHM) each gained more than 1% today to extend their year-to-date gains to over 45%.
Last week, we published Losers of REIT Earnings Season. While there were upside standouts and some solid reports within these lagging property sectors, the losers of REIT earnings season included: Office, Mortgage, Land & Agriculture, Retail, and Non-Traded REITs. For Office and Mortgage REITs, dividend cuts have begun to mount, with 15 combined reductions between the two sectors this year. Other sectors have seen increases outpace cuts by 44-to-1. 'Flight to quality' was a major theme this earnings season, with small and micro-cap REITs significantly lagging larger-cap names. Commodities disinflation was a major theme for the agriculture-focused REIT sectors - farmland, timber, and cannabis REITs. From their peaks, lumber prices are down 75%, and grain prices are down nearly 40%.
Last week, we also published Winners of REIT Earnings Season. There's more to commercial real estate than office buildings. Obscured by continued office pain, REITs delivered surprisingly strong first-quarter results. Of the 92 equity REITs that provide full-year Funds from Operations ("FFO") guidance, 40 (43%) raised their full-year earnings outlook, while 6 (7%) lowered guidance - an FFO beat rate that exceeded the historical REIT average of 40% for the first quarter. The "beat rate" for the critical property-level metric - same-store Net Operating Income ("NOI") - was actually slightly better, with over 50% of REITs providing upward revisions. Surprisingly buoyant rent growth - particularly across the residential, industrial, hospitality, technology, and retail sectors - was the prevailing theme of these upward revisions.
Additional Headlines from The Daily REITBeat on Income Builder
FCPT announced the acquisition of a National Veterinary Associates property located in Alaska for $637k at a 7.3% entry cap rate
BRT announced that its 50/50 JV that owns Chatham Court and Reflections in Dallas completed the previously announced sale of the asset which generated proceeds of approximately $19.4M
Truist Securities initiates RYN with a Hold rating
Deutsche Bank upgrades VRE to Buy from Hold
Mortgage REIT Daily Recap
Mortgage REITs also traded lower today with residential mREITs declining by 1.1% and commercial mREITs declining 1.5%. On an otherwise quiet day of newsflow, renewable energy lender Hannon Armstrong (HASI) dipped 5% while MFA Financial (MFA) and ACRES Realty (ACR) were among the upside leaders. As noted in our Earnings Recap, residential mREITs reported an average decline in BVPS of 1.9% in Q1, while commercial mREITs reported a 1.8% average decline. Within the residential mREIT sector, credit-focused mREITs fared better in Q1 - reporting a slight increase in their Book Value Per Share ("BVPS") while agency-focused REITs reported an average decline in their BVPS of about 5% in Q1. Dividend coverage was stronger for commercial mREITs with about 75% of commercial mREITs covering their dividend with Q1 adjusted EPS while just 50% of residential mREITs covered their dividend.
Economic Data This Week
The state of the U.S. housing market remains in focus on Wednesday, when we'll see Housing Starts and Building Permits data for April, which are expected to accelerate slightly after a stronger-than-expected March. On Wednesday, we'll also be watching mortgage-market data, specifically the MBA Purchase Index, which climbed to levels that were 22% above their February lows last week. We'll see Existing Home Sales data on Thursday which is expected to decline slightly in April to a 4.30 million seasonally-adjusted annualized rate - up from the lows in January of 4.0 million, but well below the 2021 highs of over 6.5 million. We'll also be watching Retail Sales data on Tuesday, weekly Jobless Claims data on Thursday, and a busy slate of PMI data throughout the week.
Disclosure: Hoya Capital Real Estate advises two Exchange-Traded Funds ("ETFs") listed on the NYSE. In addition to any long positions listed, Hoya Capital is long all components in the Hoya Capital Housing Index and in the Hoya Capital High Dividend Yield Index. Index definitions and a complete list of holdings are available on our website.
Hoya Capital Research & Index Innovations (“Hoya Capital”) is an affiliate of Hoya Capital Real Estate, a registered investment advisory firm based in Rowayton, Connecticut that provides investment advisory services to ETFs, individuals, and institutions. Hoya Capital Research & Index Innovations provides non-advisory services including market commentary, research, and index administration focused on publicly traded securities in the real estate industry.
This published commentary is for informational and educational purposes only. Nothing on this site nor any commentary published by Hoya Capital is intended to be investment, tax, or legal advice or an offer to buy or sell securities. This commentary is impersonal and should not be considered a recommendation that any particular security, portfolio of securities, or investment strategy is suitable for any specific individual, nor should it be viewed as a solicitation or offer for any advisory service offered by Hoya Capital Real Estate. Please consult with your investment, tax, or legal adviser regarding your individual circumstances before investing.
The views and opinions in all published commentary are as of the date of publication and are subject to change without notice. Information presented is believed to be factual and up-to-date, but we do not guarantee its accuracy and it should not be regarded as a complete analysis of the subjects discussed. Any market data quoted represents past performance, which is no guarantee of future results. There is no guarantee that any historical trend illustrated herein will be repeated in the future, and there is no way to predict precisely when such a trend will begin. There is no guarantee that any outlook made in this commentary will be realized.
Readers should understand that investing involves risk and loss of principal is possible. Investments in real estate companies and/or housing industry companies involve unique risks, as do investments in ETFs. The information presented does not reflect the performance of any fund or other account managed or serviced by Hoya Capital Real Estate. An investor cannot invest directly in an index and index performance does not reflect the deduction of any fees, expenses or taxes.
Hoya Capital Real Estate and Hoya Capital Research & Index Innovations have no business relationship with any company discussed or mentioned and never receives compensation from any company discussed or mentioned. Hoya Capital Real Estate, its affiliates, and/or its clients and/or its employees may hold positions in securities or funds discussed on this website and our published commentary. A complete list of holdings and additional important disclosures is available at www.HoyaCapital.com.


